This application note explains the fundamentals of swept-tuned, superheterodyne spectrum analyzers and discusses the latest advances in spectrum analyzer capabilities.
At the most basic level, a spectrum analyzer can be described as a frequency- selective, peak-responding voltmeter calibrated to display the rms value of a sine wave. It is important to understand that the spectrum analyzer is not a power meter, even though it can be used to display power directly. As long as we know some value of a sine wave (for example, peak or average) and know the resistance across which we measure this value, we can calibrate our voltmeter to indicate power.
With the advent of digital technology, modern spectrum analyzers have been given many more capabilities. In this note, we describe the basic spectrum analyzer as well as additional capabilities made possible using digital technology and digital signal processing.
Frequency domain versus time domain
Before we get into the details of describing a spectrum analyzer, we might first ask ourselves: “Just what is a spectrum and why would we want to analyze it?” Our normal frame of reference is time. We note when certain events occur. This includes electrical events. We can use an oscilloscope to view the instantaneous value of a particular electrical event (or some other event converted to volts through an appropriate transducer) as a function of time. In other words, we use the oscilloscope to view the waveform of a signal in the time domain.
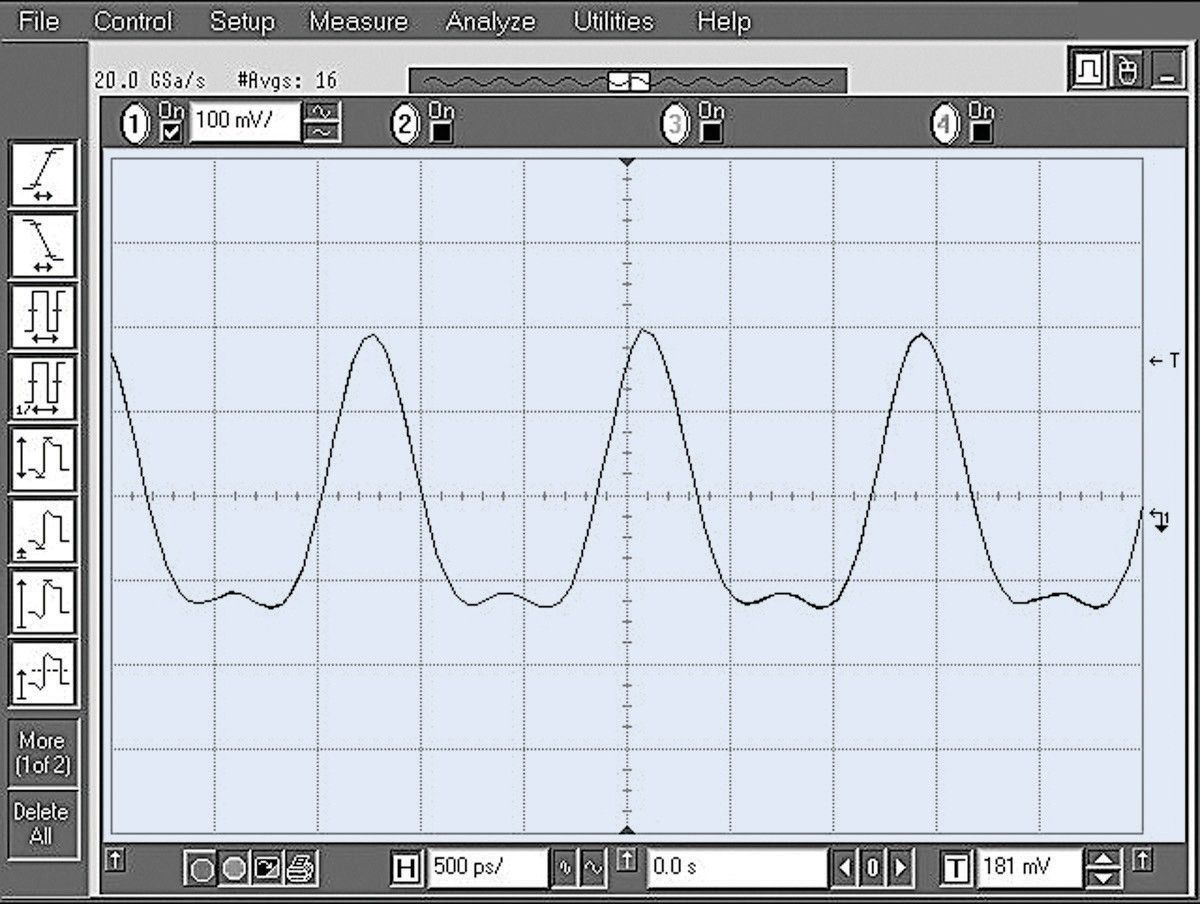
Fourier theory tells us any time-domain electrical phenomenon is made up of one or more sine waves of appropriate frequency, amplitude, and phase. In other words, we can transform a time-domain signal into its frequency domain equivalent. Measurements in the frequency domain tell us how much energy is present at each particular frequency. With proper filtering, a waveform such as the one shown in Figure 1-1 can be decomposed into separate sinusoidal waves, or spectral components, which we can then evaluate independently. Each sine wave is characterized by its amplitude and phase. If the signal we wish to analyze is periodic, as in our case here, Fourier says that the constituent sine waves are separated in the frequency domain by 1/T, where T is the period of the signal .
1. Jean Baptiste Joseph Fourier, 1768-1830. A French mathematician and physicist who discovered that periodic functions can be expanded into a series of sines and cosines.2. If the time signal occurs only once, then T is infinite, and the frequency representation is a continuum of sine waves.
Some measurements require that we preserve complete information about the signal frequency, amplitude and phase. However, another large group of measurements can be made without knowing the phase relationships among the sinusoidal components. This type of signal analysis is called spectrum analysis....
继续阅读完整内容
请查看下方广告以解锁文章剩余内容
广告加载中...
At the most basic level, a spectrum analyzer can be described as a frequency- selective, peak-responding voltmeter calibrated to display the rms value of a sine wave. It is important to understand that the spectrum analyzer is not a power meter, even though it can be used to display power directly. As long as we know some value of a sine wave (for example, peak or average) and know the resistance across which we measure this value, we can calibrate our voltmeter to indicate power.
With the advent of digital technology, modern spectrum analyzers have been given many more capabilities. In this note, we describe the basic spectrum analyzer as well as additional capabilities made possible using digital technology and digital signal processing.
Frequency domain versus time domain
Before we get into the details of describing a spectrum analyzer, we might first ask ourselves: “Just what is a spectrum and why would we want to analyze it?” Our normal frame of reference is time. We note when certain events occur. This includes electrical events. We can use an oscilloscope to view the instantaneous value of a particular electrical event (or some other event converted to volts through an appropriate transducer) as a function of time. In other words, we use the oscilloscope to view the waveform of a signal in the time domain.
Fourier theory tells us any time-domain electrical phenomenon is made up of one or more sine waves of appropriate frequency, amplitude, and phase. In other words, we can transform a time-domain signal into its frequency domain equivalent. Measurements in the frequency domain tell us how much energy is present at each particular frequency. With proper filtering, a waveform such as the one shown in Figure 1-1 can be decomposed into separate sinusoidal waves, or spectral components, which we can then evaluate independently. Each sine wave is characterized by its amplitude and phase. If the signal we wish to analyze is periodic, as in our case here, Fourier says that the constituent sine waves are separated in the frequency domain by 1/T, where T is the period of the signal .
1. Jean Baptiste Joseph Fourier, 1768-1830. A French mathematician and physicist who discovered that periodic functions can be expanded into a series of sines and cosines. 2. If the time signal occurs only once, then T is infinite, and the frequency representation is a continuum of sine waves.
Some measurements require that we preserve complete information about the signal frequency, amplitude and phase. However, another large group of measurements can be made without knowing the phase relationships among the sinusoidal components. This type of signal analysis is called spectrum analysis.
Because spectrum analysis is simpler to understand, yet extremely useful, we begin by looking first at how spectrum analyzers perform spectrum analysis measurements, starting in Chapter 2.
Theoretically, to make the transformation from the time domain to the frequency domain, the signal must be evaluated over all time, that is, over infinity. However, in practice, we always use a finite time period when making a measurement.
figure 1-1. Complex time-domain signal
You also can make Fourier transformations from the frequency to the time domain.
This case also theoretically requires the evaluation of all spectral components over frequencies to infinity. In reality, making measurements in a finite bandwidth that captures most of the signal energy produces acceptable results. When you perform a Fourier transformation on frequency domain data, the phase of the individual components is indeed critical. For example, a square wave transformed to the frequency domain and back again could turn into a sawtooth wave if you do not preserve phase.
What is a spectrum?
So what is a spectrum in the context of this discussion? A spectrum is a collection of sine waves that, when combined properly, produce the time-domain signal under examination. Figure 1-1 shows the waveform of a complex signal. Suppose that we were hoping to see a sine wave. Although the waveform certainly shows us that the signal is not a pure sinusoid, it does not give us a definitive indication of the reason why.
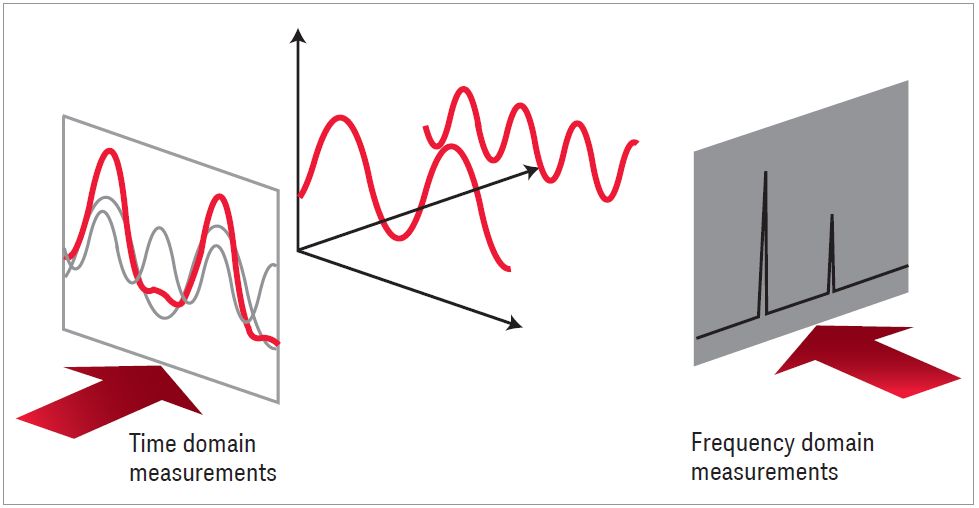
Figure 1-2 shows our complex signal in both the time and frequency domains. The frequency-domain display plots the amplitude versus the frequency of each sine wave in the spectrum. As shown, the spectrum in this case comprises just two
sine waves. We now know why our original waveform was not a pure sine wave. It contained a second sine wave, the second harmonic in this case. Does this mean we have no need to perform time-domain measurements? Not at all. The time domain is better for many measurements, and some can be made only in the time domain. For example, pure time-domain measurements include pulse rise and fall times, overshoot and ringing.
Why measure spectra?
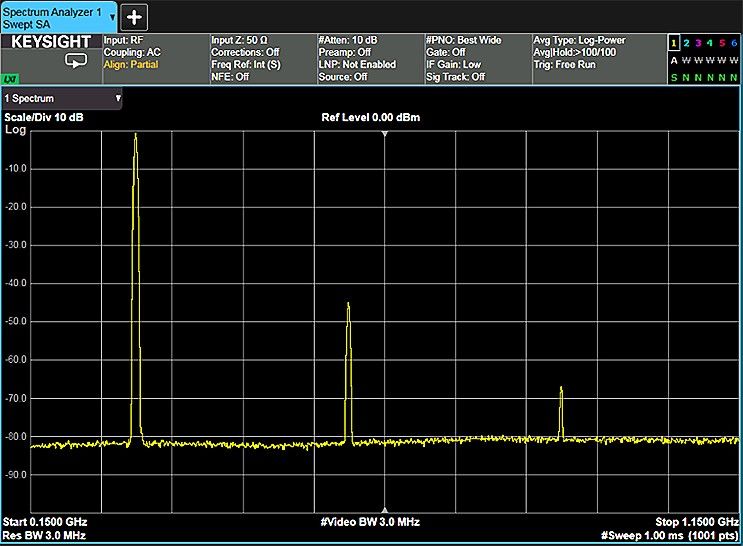
The frequency domain also has its measurement strengths. We have already seen in Figures 1-1 and 1-2 that the frequency domain is better for determining the harmonic content of a signal.
People involved in wireless communications are extremely interested in out-of-band and spurious emissions. For example, cellular radio systems must be checked for harmonics of the carrier signal that might interfere with other systems operating at the same frequencies as the harmonics.
Engineers and technicians are also very concerned about distortion of the message modulated onto a carrier.
Third-order intermodulation (two tones of a complex signal modulating each other) can be particularly troublesome because the distortion components can fall within the band of interest, which means they cannot be filtered away.
Spectrum monitoring is another important frequency-domain measurement activity. Government regulatory agencies allocate different frequencies for various radio services, such as broadcast television and radio, mobile phone systems, police and emergency communications, and a host of other applications. It is critical that each of these services operates at the assigned frequency and stays within the allocated channel bandwidth. Transmitters and other intentional radiators often must operate at closely spaced adjacent frequencies. A key performance measure for the power amplifiers and other components used in these systems is the amount of signal energy that spills over into adjacent channels and causes interference.
Figure 1-2. Relationship between time and frequency domain
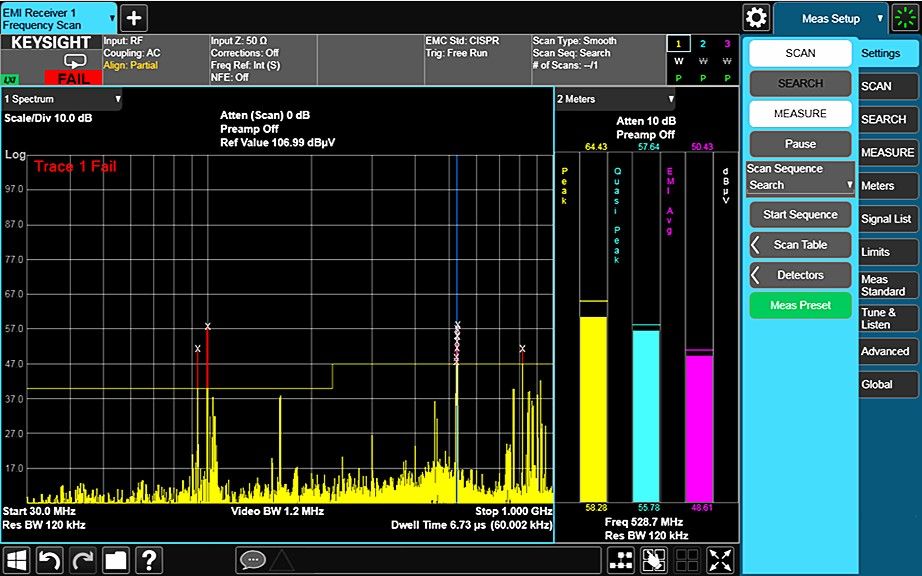
Electromagnetic interference (EMI) is a term applied to unwanted emissions from both intentional and unintentional radiators. These unwanted emissions, either radiated or conducted (through the power lines or other interconnecting wires), might impair the operation of other systems. Almost anyone designing or manufacturing electrical or electronic products must test for emission levels versus frequency according to regulations set by various government agencies or industry-standard bodies.
Figure 1-3. Harmonic distortion test of a transmitter\
Figure 1-4. GSM radio signal and spectral mask showing limits of unwanted emissions
Figure 1- 5. Two-tone test on an RF power amplifier
Figure 1-6. Radiated emissions plotted against CISPR11 limits as part of an EMI test
Noise is often the signal you want to measure. Any active circuit or device will generate excess noise. Tests such as noise figure and signal-to-noise ratio (SNR) are important for characterizing the performance of a device and its contribution to overall system performance.
Figures 1-3 through 1-6 show some of these measurements on an X-Series signal analyzer.
Types of signal analyzers
The first swept-tuned superheterodyne analyzers measured only amplitude.
However, as technology advanced and communication systems grew more complex, phase became a more important part of the measurement.
Spectrum analyzers, now often labeled signal analyzers, have kept pace. By digitizing the signal, after one or more stages of frequency conversion, phase as well as amplitude is preserved and can be included as part of the information displayed. So today’s signal analyzers such as the Keysight X-Series combine the attributes of analog, vector and FFT (fast Fourier transform) analyzers. To further improve capabilities, Keysight’s X-Series signal analyzers incorporate a computer, complete with a removable disk drive that allows sensitive data to remain in a controlled area should the analyzer be removed.
Advanced technology also has allowed circuits to be miniaturized. As a result, rugged portable spectrum analyzers such as the Keysight FieldFox simplify tasks such as characterizing sites for transmitters or antenna farms. Zero warm-up time eliminates delays in situations involving brief stops for quick measurements. Due to advanced calibration techniques, field measurements made with these handheld analyzers correlate with lab-grade bench-top spectrum analyzers within 10ths of a dB.
In this application note, we concentrate on swept amplitude measurements, only briefly touching on measurements involving phase–see Chapter 8.
This application note will give you insight into your particular spectrum or signal analyzer and help you use this versatile instrument to its maximum potential.
Read 37652 times
The cart is empty
Login
Please support our site by viewing this advertisement.
Please support our site by viewing this advertisement